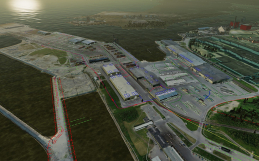
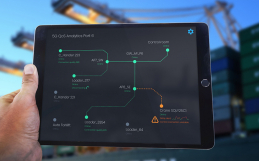
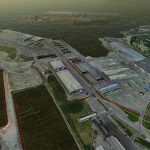
Centria University of Applied Sciences has developed 5G data gathering and visualization platform to create the situational awareness of any industrial environment. The aim of the data gathering and visualization platform is to collect and store the data and to present it in the map user interface (UI). In this demonstration the platform is used for the port environment to create the situational awareness from the area, by displaying vessels, trains, weather and sensors on the map.
See video about the platform features.
Contact:
Marjut Koskela, [email protected]
Related Posts